2026 LDC U.S. Latino Economic Impact Report · Part Two
U.S. Latinos: a $5.1 trillion economy powering America’s growth.
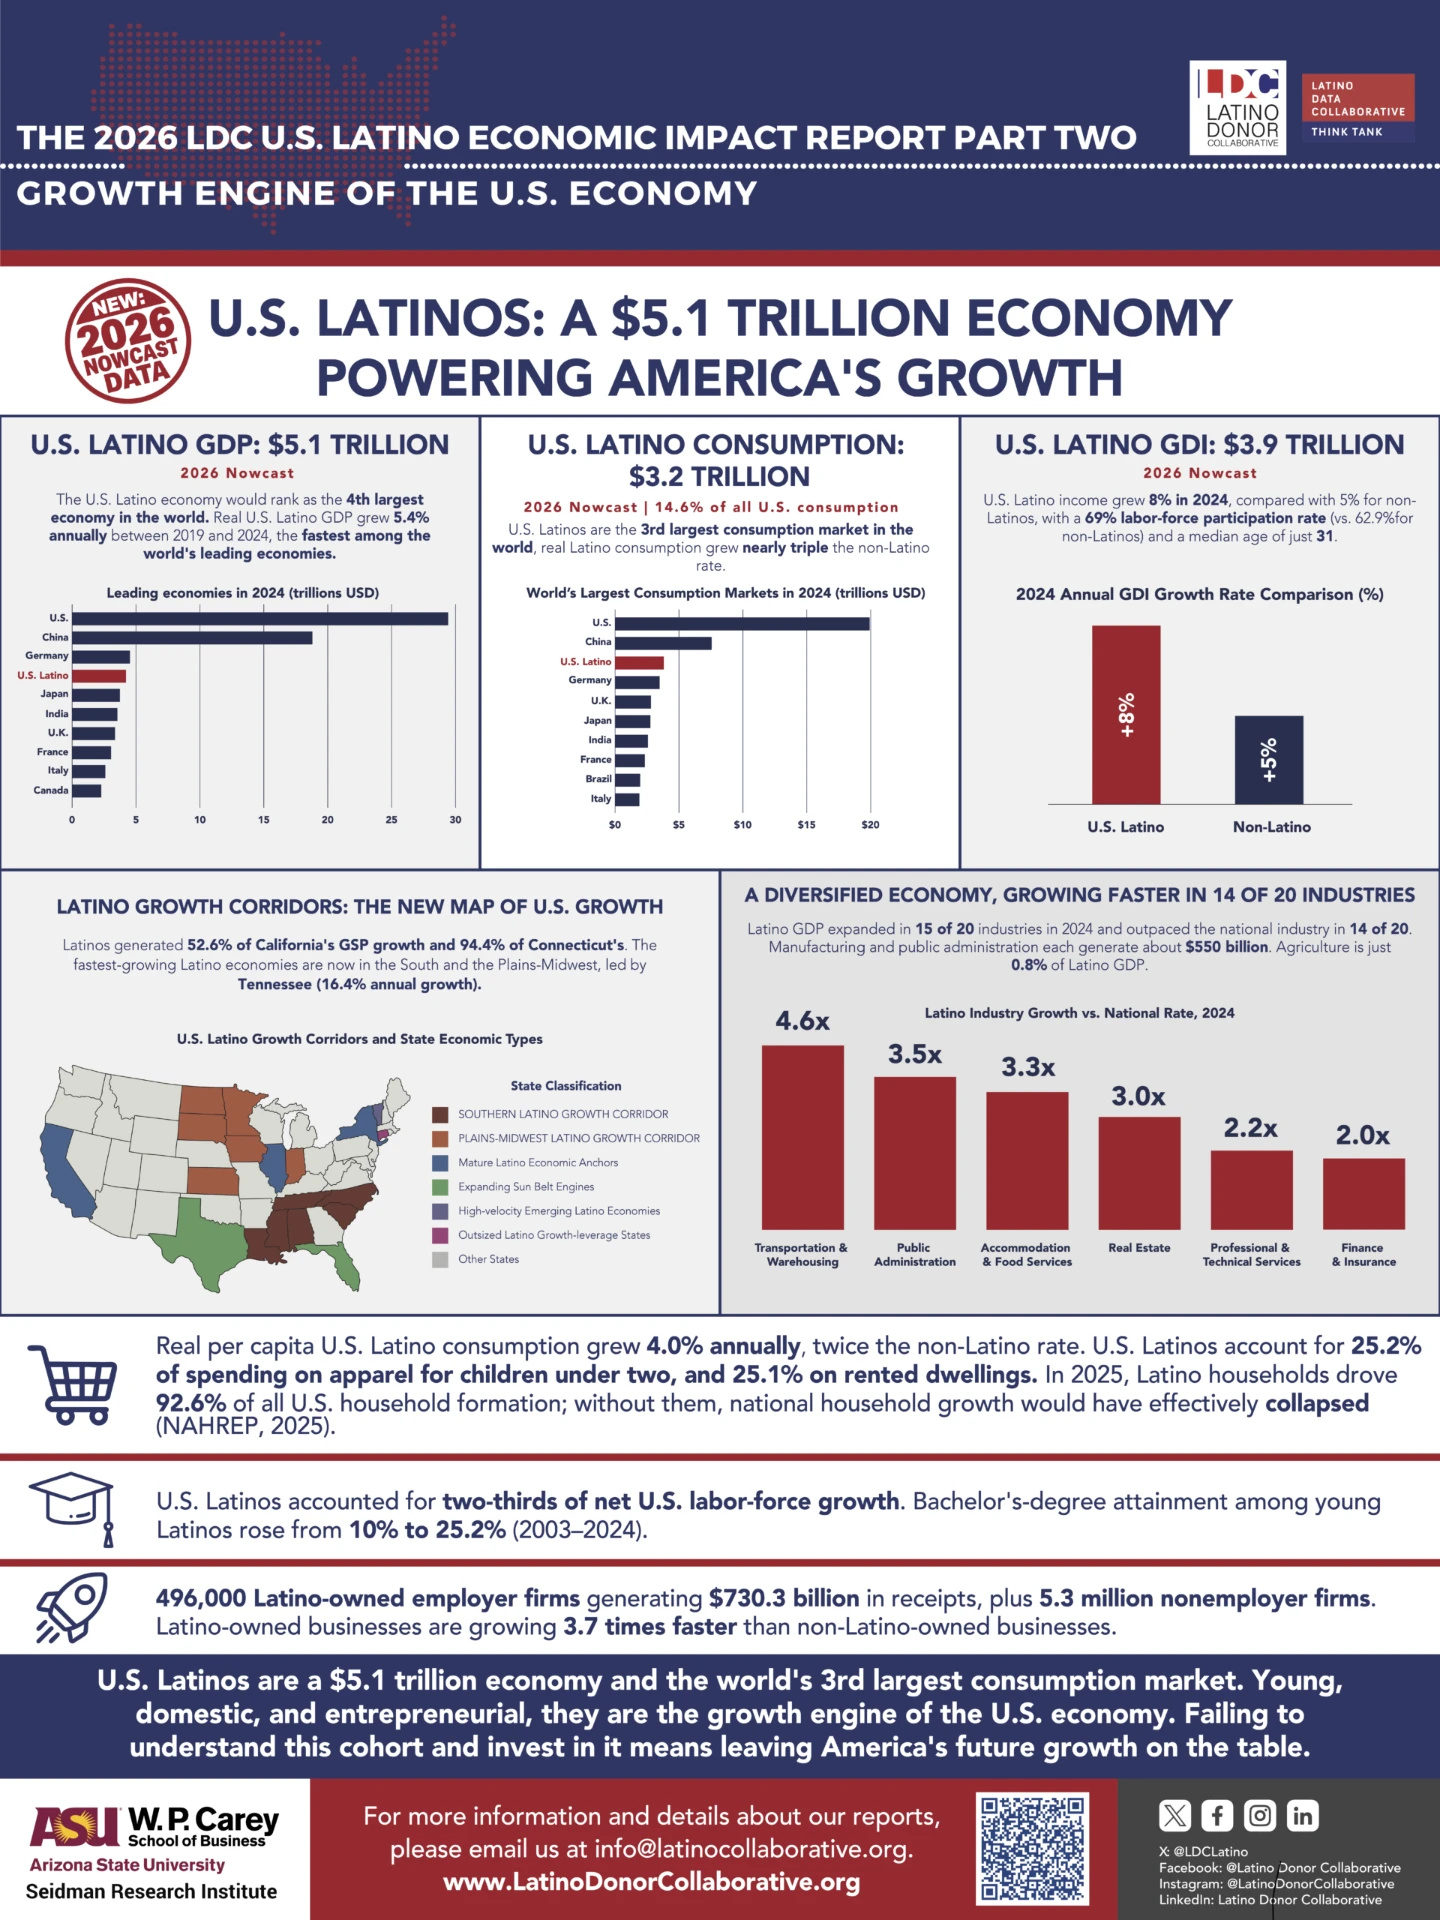
The Latino Donor Collaborative’s latest report moves the story from a $4.4 trillion 2024 baseline to a $5.1 trillion 2026 nowcast—with consumption, income and entrepreneurship reinforcing the growth outlook.
By Camilo Alfaro · CEO & Founder, Autoproyecto · October 28, 2026

$5.1T
U.S. Latino GDP
2026 nowcast
$3.2T
Latino consumption
2026 nowcast · 14.6% of U.S. consumption
5.4%
Annual real GDP growth
2019–2024 · inflation-adjusted
Source: Latino Donor Collaborative and the Latino Data Collaborative think tank, with the Seidman Research Institute at Arizona State University’s W. P. Carey School of Business.
The GDP comparison
Same growth story. Different data years.
Our 2026 U.S. Latino GDP article describes $4.4 trillion in economic output in 2024. LDC Part Two confirms that baseline and estimates $5.1 trillion for 2026. The newer number does not turn the historical figure into an error.
2024 · Historical baseline
$4.4T
2026 · LDC nowcast
$5.1T
An indicative $700 billion difference · approximately 15.9% above the rounded 2024 level.
This is a comparison of nominal dollar levels, one historical and one estimated. It is not realized growth, not inflation-adjusted growth, and not an annual growth rate. LDC’s separate 5.4% figure is annual real GDP growth over 2019–2024. The older CLU-CERF article’s 6.4% refers to 2023–2024 and its 4.6% to 2010–2024; those windows and research series are different.
Three distinct measures
Output, spending and income.
$5.1T
Economic output · 2026 nowcast
LDC’s 2026 nowcast for U.S. Latino GDP. Its global comparison places the Latino economy fourth, using 2024 international GDP benchmarks; this is not a synchronized 2026 world ranking.
- GDP · 2026 nowcast
- $5.1 trillion · output
- Consumption · 2026 nowcast
- $3.2 trillion · spending
- GDI · 2026 nowcast
- $3.9 trillion · income
Growth reaches across industries and states.
In 2024, Latino GDP expanded in 15 of 20 industries and outpaced the corresponding national industry in 14 of 20. The infographic highlights the following growth-rate multiples.
Transportation & warehousing4.6×
The Latino industry’s 2024 growth rate was approximately 4.6 times its national counterpart’s rate. This is a growth comparison, not a share of industry GDP.
Public administration3.5×
The Latino industry’s 2024 growth rate was approximately 3.5 times its national counterpart’s rate. This is a growth comparison, not a share of industry GDP.
Accommodation & food services3.3×
The Latino industry’s 2024 growth rate was approximately 3.3 times its national counterpart’s rate. This is a growth comparison, not a share of industry GDP.
Real estate3.0×
The Latino industry’s 2024 growth rate was approximately 3.0 times its national counterpart’s rate. This is a growth comparison, not a share of industry GDP.
Professional & technical services2.2×
The Latino industry’s 2024 growth rate was approximately 2.2 times its national counterpart’s rate. This is a growth comparison, not a share of industry GDP.
Finance & insurance2.0×
The Latino industry’s 2024 growth rate was approximately 2.0 times its national counterpart’s rate. This is a growth comparison, not a share of industry GDP.
52.6%
of California’s GSP growth
Latino contribution · 2019–2024
94.4%
of Connecticut’s GSP growth
Latino contribution · 2019–2024
16.4%
annual real Latino GSP growth in Tennessee
2019–2024 · inflation-adjusted
GSP means gross state product. These state growth figures describe historical periods, not the 2026 GDP nowcast.
The people behind the economic momentum.
Workforce: Latinos accounted for roughly two-thirds of net U.S. labor-force growth from 2003 to 2024. Their 2024 participation rate was 69%, compared with 62.9% for non-Latinos.
Education: Bachelor’s-degree attainment rose from 10% to 25.2% between 2003 and 2024, strengthening the human-capital foundation behind future growth.
Entrepreneurship: The LDC infographic identifies 496,000 Latino-owned employer firms generating $730.3 billion in receipts, plus 5.3 million nonemployer firms. It reports Latino-owned business growth at 3.7 times the non-Latino rate.
These LDC business figures are a different source vintage from the 553,000 employer firms and $832 billion presented in our Stanford SOLE article. They are not a before-and-after series, and the difference should not be interpreted as a decline.
What automotive leaders can take from this
Growing output, spending and household formation support the case for sustained Hispanic demand strategies. The report is macroeconomic evidence—not a vehicle-sales forecast or a promise of campaign lift. Brands still need category-specific audience intelligence and measured consideration, manufacturer research and dealer-shopping outcomes.
The original LDC infographic.
Sources & methodology
Primary source: the 2026 LDC U.S. Latino Economic Impact Report, Part Two. All comparisons above identify the measure and period. The infographic’s 2026 headlines are nowcasts; international benchmarks and industry growth refer to 2024. The nominal GDP difference is calculated from rounded report values.